| |
p53 database
p53 database
Download the database
Database curation
MUT-MAT 2: p53 mutation prediction
p53 mutation in cell lines
(new)
p53 mutation and cancers: an extensive analysis of p53 mutation in every cancer
The p53 Mutation Handbook
p53 mutation distribution
p53 mutation in breast cancer: about apples, oranges and unusual p53 mutations:
a response to Patoc et al.
|
p53 database curation
A full description of the meta-analysis of the p53 mutation database can be found in this publication:
Soussi, T., Asselain, B., Hamroun, D., Kato, S., Ishioka, C., Claustres, M. and Beroud, C. (2006) Meta-analysis of the p53 mutation database for mutant p53 biological activity reveals a methodologic bias in mutation detection. Clin Cancer Res, 12, 62-69. Download the pdf
Download the supplementary material
p53 mutations in the literature
We and others have observed that several publications report unusual spectrum of p53 mutations :
These studies reveals various characteristics that are not generally described in other cancers:
(a ) many tumors present several p53 gene mutations (as many as ten),
(b ) virtually no mutations are described at hotspot codons,
(c ) there is a high proportion of ‘‘neutral’’ mutations, which do not change the amino acid,
(d ) these studies describe p53 mutants that are very rarely found in other publications, some of them being exclusively described in the reports,
(e ) several of these studies also reported multiple mutations of the Ki-ras gene in codons other than codons 12 and 13.
Meta analysis and exclusion critera: a brief explanation
Methodology
The mean and 95% confidence interval (CI) of the biological activity of all mutants was calculated by using the transactivational activity measured on the WAF1 promoter.
For data analysis and presentation of the results, we used a similar approach to that used for meta-analyses comparing clinical trials. For each cancer, the mean and 95% CI of p53 activity in each publication were graphically displayed. The reference value corresponds to the mean and 95% CI of all studies for the specific cancer.
In this statistical analysis, the width of the 95% CI depends on both the scatter of the individual values (SD) and the sample size: the width of the 95% CI increases as the sample size decreases. Only publications reporting 10 or more mutations were analyzed in this study in order to ensure significant results.
Cancers with >500 published mutations were analyzed, corresponding to the 10 most frequent cancers.
|
Results
Most publications display a homogeneous distribution with a 95% CI, which includes the mean value of the activity for all studies combined for a specific type of cancer
54 out of range studies have been identified : in these publications, the distribution of p53 mutant activity significantly differs from the average as their CI does not include the global mean value. A deeper analysis of these publications shows that they have some commun features such as :
- Multiple mutations in the same tumour
- High frequency of polymorphic changes
- High frequency of novel mutations previously undescribed
- Low frequency of mutations at hot spot position
|
|
Among these excluded studies, there is the Gao publication in lung cancer that has been known to cause several problems in the analysis and interpretation of the epidemiological analysis of the p53 mutation database in lung cancer (see below NSCLC)
Therefore, we believe that curation of the UMD p53 mutations database will lead to a better set of data for the analysis of p53 mutations
 |
Figure 1: Meta-analysis of p53 loss of function in NSCLC. Dot and bars: mean and 95% CI of mean p53 activity as measured by transactivation with the WAF1 promoter. The mean and 95% CI of p53 activity for all studies combined for a specific type of cancer is shown on the far left of each graph. The horizontal line shows the mean of the combined studies. The publication code is indicated on the x-axis: the first number is an anonymous ID for the publication and the second number indicates the number of p53 mutants included in this study. Studies are presented from left to right in decreasing order of number of p53 mutants. The y-axis corresponds to p53 transactivation activity, with a value of -1.5 for the negative control and a value of 2.5 for 100% of wt activity.
2000-70: Gao study |
 |
Figure 2: Meta-analysis of p53 loss of function in CRC. Dot and bars: mean and 95% CI of mean p53 activity as measured by transactivation with the WAF1 promoter. The mean and 95% CI of p53 activity for all studies combined for a specific type of cancer is shown on the far left of each graph. The horizontal line shows the mean of the combined studies. The publication code is indicated on the x-axis: the first number is an anonymous ID for the publication and the second number indicates the number of p53 mutants included in this study. Studies are presented from left to right in decreasing order of number of p53 mutants. The y-axis corresponds to p53 transactivation activity, with a value of -1.5 for the negative control and a value of 2.5 for 100% of wt activity.
Red Star: out of range studies
|
 |
Figure 3: Meta-analysis of p53 loss of function in HNSCC. Dot and bars: mean and 95% CI of mean p53 activity as measured by transactivation with the WAF1 promoter. The mean and 95% CI of p53 activity for all studies combined for a specific type of cancer is shown on the far left of each graph. The horizontal line shows the mean of the combined studies. The publication code is indicated on the x-axis: the first number is an anonymous ID for the publication and the second number indicates the number of p53 mutants included in this study. Studies are presented from left to right in decreasing order of number of p53 mutants. The y-axis corresponds to p53 transactivation activity, with a value of -1.5 for the negative control and a value of 2.5 for 100% of wt activity.
Red Star: out of range studies
|
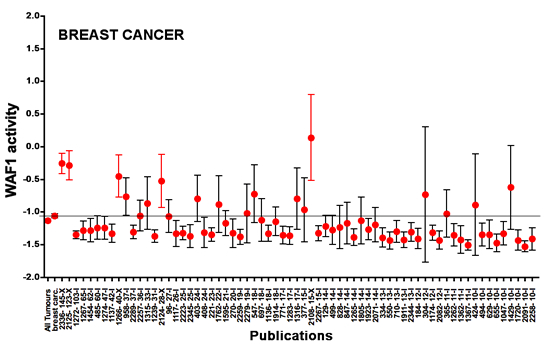 |
Figure 4: Meta-analysis of p53 loss of function in Breast cancer. Dot and bars: mean and 95% CI of mean p53 activity as measured by transactivation with the WAF1 promoter. The mean and 95% CI of p53 activity for all studies combined for a specific type of cancer is shown on the far left of each graph. The horizontal line shows the mean of the combined studies. The publication code is indicated on the x-axis: the first number is an anonymous ID for the publication and the second number indicates the number of p53 mutants included in this study. Studies are presented from left to right in decreasing order of number of p53 mutants. The y-axis corresponds to p53 transactivation activity, with a value of -1.5 for the negative control and a value of 2.5 for 100% of wt activity.
more info on breast cancer p53 mutations
|
|
|